
The flaws of current federal flood maps and how communities can better use federal flood maps to prepare for future flooding.
In this post:
- Federal flood maps are a key tool that individuals and communities use to determine their flood risk
- Current federal flood maps do not accurately present flood risk, as many maps are outdated, fail to incorporate sea level rise, and overlook rainfall and riverine flooding
- Federal flood maps significantly underestimate the number of people living in areas of high flood risk and offer incomplete coverage across the United States
- Federal flood map inaccuracies can have devastating consequences for individuals and communities
- Updated flood insurance maps would help individuals and communities make informed decisions about flood hazards
Imagine you just bought your dream property. After months of inspections and years of scrimping and saving, you finally move in. A week after you unpack, you go down to the basement to grab tools to hang up some family pictures. But your toolbox is soaked. In fact, everything in the basement is soaked — mildew grows on boxes, and water pools along baseboards. You face repair work that will cost several thousand dollars. You realize, in anger and disbelief, that your property is prone to flooding. You had to sit through dozens of meetings and reviewed dozens more legal documents, bank statements, and mortgage papers — how did nobody warn you about this?
Hundreds of thousands of Gulf Coast residents made a similar, shocking discovery following Hurricane Harvey. When Harvey made landfall over Texas in 2017, it devastated the Gulf Coast, causing nearly $125 billion in damage and destroying over 100,000 homes. Many of the residents affected were unaware they even lived in areas of high flood risk. Federal flood maps should have allowed Gulf Coast residents to understand their flood risk prior to the storm. As Harvey showed, though, federal flood maps are not always reliable, and when they fail to fulfill their purpose, the results are tragic.
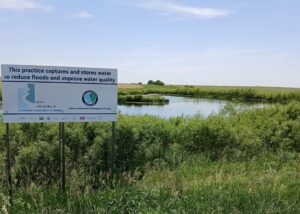
When used effectively, federal flood maps allow individuals and communities to determine their flood risk. Federal flood maps, along with flood insurance and strategic planning efforts, should serve as safety valves to limit the damages of a storm like Harvey. These safety valves, however, are often unreliable. This post will outline the flaws of current federal flood maps and explore how communities can better use federal flood maps to prepare for future flooding.
How do federal flood maps demonstrate flood risk?
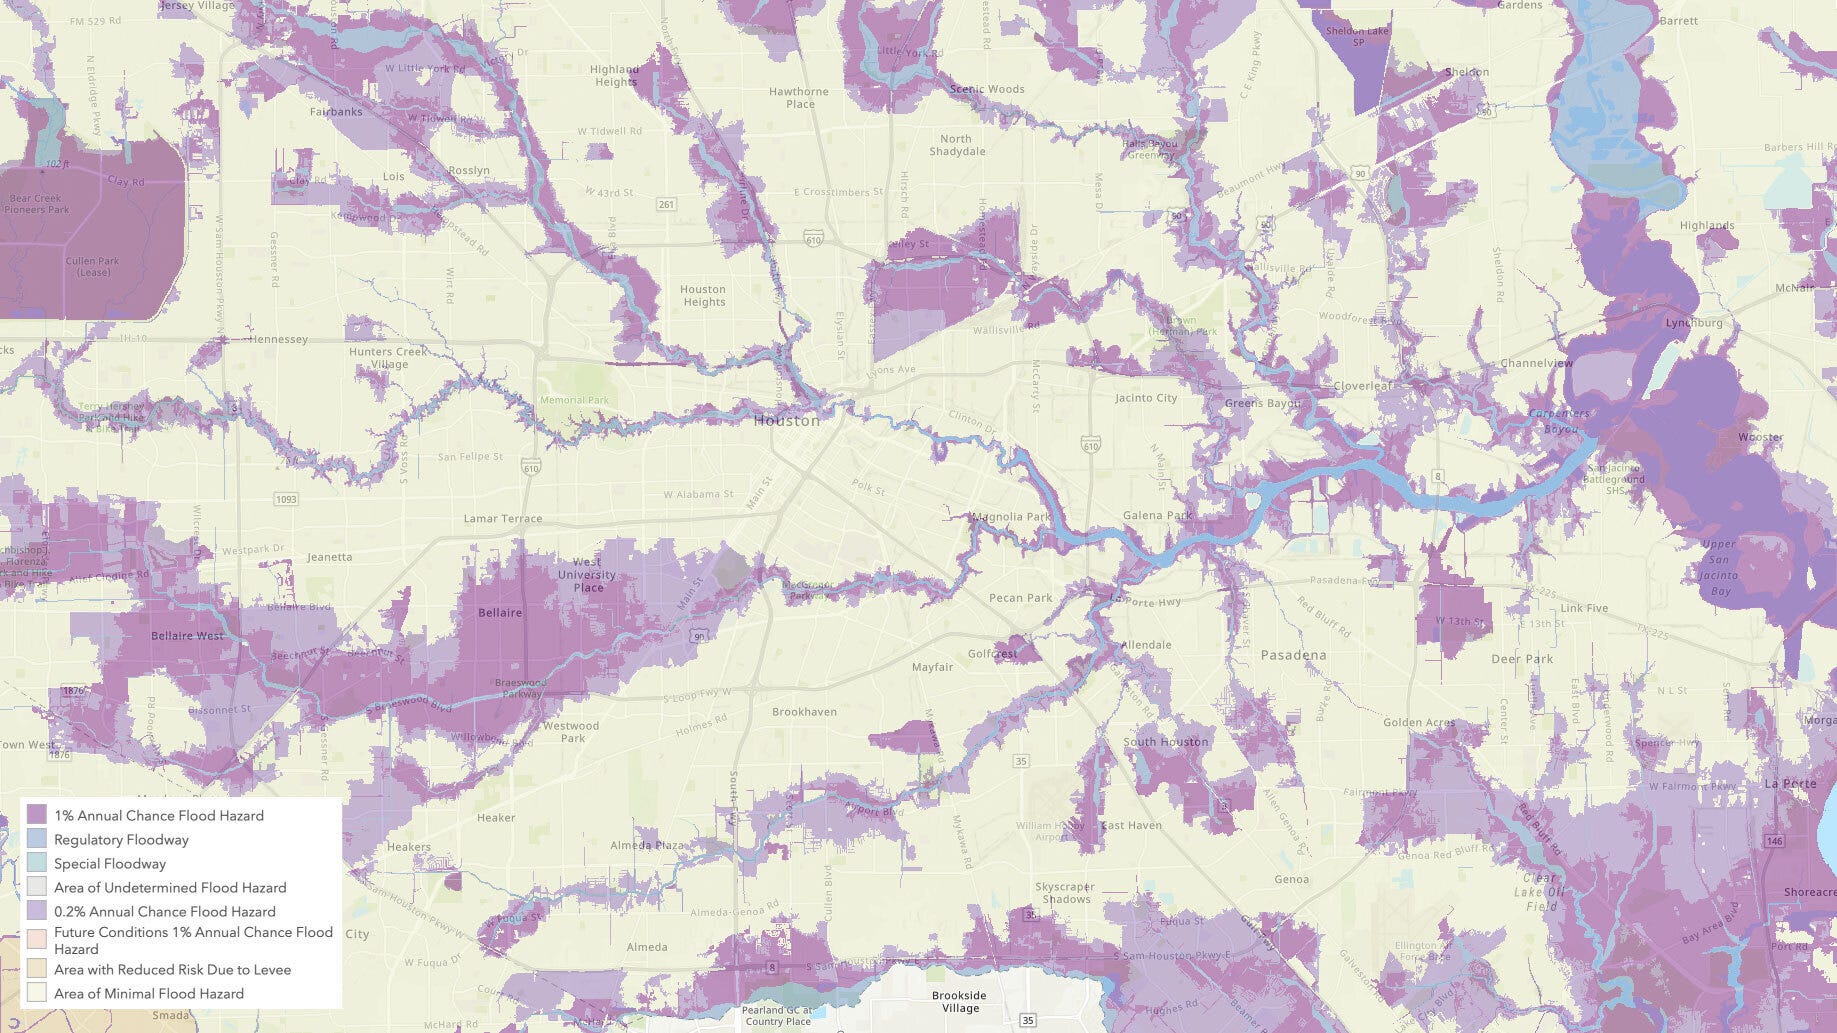
To understand the problems with federal flood maps, one must understand how these maps demonstrate flood risk. Federal flood maps came out of the National Flood Insurance Program (NFIP) and, until recently, were used by the Federal Emergency Management Agency (FEMA) to set policy rates for federal flood insurance. These federal flood maps (also referred to as Federal Insurance Rate Maps, or simply, FIRMs) show if a property falls into a 100-year floodplain. Properties that lie in the 100-year floodplain, or the Special Flood Hazard Area, face a 1% or greater chance of annual flooding.
Under FEMA’s new rating methodology, Risk Rating 2.0, flood insurance rates will be calculated based on a number of factors that consider an individual property’s flood risk, not just where the property is on a map. However, FEMA will still use federal flood maps to determine whether a property owner must buy flood insurance and inform residents if they live in a Special Flood Hazard Area. Communities also use these maps for city and regional planning, referencing these maps when implementing local building and zoning codes. Federal flood maps help communities set local regulations around floodplains and make decisions to allow development in certain areas.
How do federal flood maps demonstrate risk, and how do they affect flood insurance?
- Federal flood maps are used to determine if a homeowner is required to purchase flood insurance. These maps show how likely an area is to flood with a series of risk categories, ranging from minimal (low flood risk) to special flood hazard (high flood risk). Although there are more than 15 risk categories, all categories fall into two broader designations: areas that are in Special Flood Hazard Areas (SFHAs), and areas that are outside of the SFHA. All property owners within the SFHA (or 100-year floodplain) must purchase flood insurance if they wish to obtain a federally backed mortgage. Property owners outside the SFHA are encouraged but not required to purchase flood insurance as the condition of a federally backed mortgage.
Flood insurance maps structurally and significantly underestimate flood risk
Unfortunately, federal flood maps are not perfect. These maps have a number of flaws that undermine their accuracy and make it difficult for both individuals and communities to fully understand their flood risk. If communities don’t understand their risk, they are likely to face the same damage that Gulf Coast residents faced following Hurricane Harvey.
Federal flood maps present flawed data on flood risk in five key ways, as outlined below.
1. Provide outdated information: Current federal flood maps are often outdated, failing to account for new flood risks, such as sea level rise, increased coastal flooding, and shifting precipitation patterns. Nearly 11% of current federal flood maps use information from the 1970s and 1980s, and more than 75% of flood maps in use are older than 5 years. For example, Hitchcock, Texas, which experienced severe flooding during Hurricane Harvey, had a federal flood map that was last updated in 1983. A 2017 Inspector General report found that only 42% of FEMA’s maps “adequately identified the level of flood risk.” In other words, more than half of current federal flood maps may be inaccurate.
2. Fail to incorporate sea level rise: Federal flood maps rely on historical storm data, which do not account for the increased probability of coastal flooding due to sea level rise. For example, current federal flood maps would not account for the 1–2 feet of sea level rise a home owner in Tampa, Florida, is expected to see over a 30-year mortgage. In the last 20 years, global sea levels have risen 2.5 inches, with greater impacts in vulnerable coastal areas like Miami, Florida, where sea levels rose over 4 inches in that same timeframe. All these factors indicate that a home along the coastline is likely to be at greater risk of flooding than current federal flood maps demonstrate.
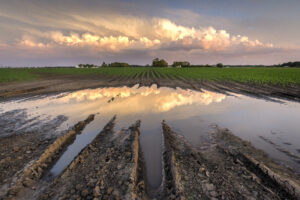
3. Overlook river and rainfall flooding: Federal flood maps do not represent all types of flood risks, often failing to factor in riverine and rainfall-driven flooding. Because of this, many federal flood maps underestimate flood risk, particularly when evaluating flooding hazards posed by smaller rivers and streams. Rainfall flooding events will likely become more intense over the next few decades; just over the last 20 years, rainfall has increased 2.25 inches a decade. Homeowners living in areas expecting more rain in the future should understand that current flood maps may not reflect the actual flood risk. This is especially true of areas with combined rainfall and riverine flood risks, such as in Illinois, where recent rainfall swelled streams and caused flooding that has damaged properties across the state.
4. Offer patchy coverage across the U.S.: Current flood insurance maps do not sufficiently cover exposed areas in key parts of the U.S. An independent research team found that many federal flood maps do not adequately account for vulnerable populations located along the Pacific coast, in urban centers around the Great Lakes, and across the inland United States. It is unlikely that federal flood maps accurately show how streets flood in large urban areas. That means federal flood maps may not show how basement apartments along a busy street in Chicago regularly get very damp during heavy rains. In a comprehensive study of flooding across the U.S., the First Street Foundation found significant differences between their model and federal flood maps, particularly in the Western U.S. In Utah, Wyoming, and Montana, the First Street model identified more than four times the number of properties with substantial flood risk than federal flood maps identified.
5. Underestimate high risk: Because federal flood maps seriously underestimate the chance of flooding, many residents and homeowners fail to realize that they live in areas of high flood risk. A peer-reviewed model created by the First Street Foundation found 14.6 million properties in the U.S. face significant flood risk, while federal flood maps only identified 8.7 million properties in the 100-year floodplain. The First Street Foundation model shows that nearly 70% more properties have substantial flood risk than current federal flood maps identify. As a result, nearly 6 million property owners don’t know their properties are at risk of flooding, and those risks may only increase over time. Homeowners in South Dakota, Nebraska, and New Mexico, for example, could see their flood risk increase five-fold in the next 70 years. First Street Foundation’s report also shows that properties with substantial risk across the U.S. will increase to 16.2 million by 2050.
When taken together, these five flaws gravely underestimate the number of homes and communities that face high flood risks.
Current flood insurance maps create a false sense of security
Flood insurance maps do not necessarily predict where flooding will occur. Even the 100-year floodplain standard was based on a compromise between the United States Army Corps of Engineers and local stormwater departments, not settled science. The 100-year floodplain standard has made it difficult for property owners and communities to understand how flood risk varies outside of floodplains.
For example, imagine your home — the same one in which you invested your nest egg — is not in a high flood risk area, according to a federal flood map, and you have many pages of mortgage and bank papers to prove it. However, your basement is full of moldy boxes and you have to replace water-damaged floors, all the same. Additionally, because the property is outside of a high flood risk area, you didn’t buy flood insurance and don’t have any fallback to cover the cost of your damages. Just because your property is not in the 100-year floodplain doesn’t mean that it isn’t at risk of flooding.
Federal flood maps and the 100-year floodplain “create a false sense that flood risk is binary by focusing on whether a property is ‘inside’ or ‘outside’ of the [Special Flood Hazard Area],” according to a recent study from University of Pennsylvania’s Wharton School. The risk/no-risk binary that flood insurance maps present through the 100-year floodplain make it difficult for individuals and communities to accurately prepare for and identify flood risk. In a recent example, almost three-quarters of the homes that Hurricane Harvey flooded in Harris County, Texas, were outside of the Special Flood Hazard Area.
The problem created by this binary is also reflected in data collected on National Flood Insurance Program claims. According to FEMA, “more than 25 percent of the National Flood Insurance Program (NFIP) claims are for structures outside identified floodplains, in low to medium risk areas.” If a property is outside of a high risk area, that property may still be at risk of flooding. The way FEMA creates a high risk/low risk binary can create a false sense of security in community members and property owners outside of the 100-year floodplain.
Fortunately, some steps have been taken to help people better understand their flood risk. While FEMA’s new methodology, Risk Rating 2.0, won’t eliminate the binary 100-year floodplain, it will deliver flood insurance rates that better reflect actual flood risk. Additionally, more tools are helping the public understand their flood risk. Last year, First Street Foundation released Flood Factor, a tool that details flood risk for 142 million properties in the contiguous U.S. and captures more types of risk than traditional flood maps. Additionally, First Street Foundation added dollar estimates of flood damage for individual residential homes to the tool, further highlighting the financial cost of flood risk.
Moving forward: Updating flood maps to accurately reflect risk
Federal flood maps greatly influence individuals purchasing homes and communities investing in resilient infrastructure. Outdated or inaccurate flood insurance maps create enormous unintended risks and provide unreliable information to individuals and communities that are trying to plan for the future. Updated flood insurance maps that accurately represent the magnitude of flood risks and show the variation in flood risk throughout and beyond the 100-year floodplain would help individuals and communities make informed decisions about flood hazards and mitigation steps.
This post was authored by Madeleine Lane, Policy Fellow.